
Blog /
Calculate Monthly Cohort Retention Without Counting Unfinished Months
SyneHQ
On this page
A retention chart can punish the newest cohort simply because it has not had time to return. Another version looks healthy because its denominator quietly excludes everyone who stopped using the product.
Both errors come from an unclear definition of the cells. Before writing SQL, decide who enters a cohort, what counts as activity, and which months have been fully observed.
This walkthrough builds a small monthly retention table in DuckDB using fictional signup and report-view events. There is no external data source or account requirement. Download cohort-retention.sql and run duckdb < cohort-retention.sql in a fresh session. It was tested with DuckDB CLI 1.2.1.
Define the denominator and the calendar
A cohort contains every user who signed up in the same UTC calendar month. An active user has at least one report-view event during the measured month, on or after signup. Every cell divides distinct active users by the original signup cohort size.
Month zero is the signup calendar month. Month one is the next calendar month. These are not rolling 30-day periods, and this is not “returned on or after day N” retention. A user who signs up on January 31 has a shorter month zero than a user who signs up on January 1. That tradeoff should be visible to the reader.
Our observation date is April 15, 2026. April is incomplete, so only months ending before April 1 are eligible. We assume the event source is complete for those closed months. In a real pipeline, use its verified completeness watermark as well as the calendar.
Build the eligible cells before counting activity
The query first fixes the cohort sizes. It deduplicates activity to one user per cohort month and month number, then builds the grid of fully observed cells. A left join retains a completed month with no activity.
-- Run in a fresh DuckDB session. All fixture dates use UTC calendar days.
CREATE TEMP TABLE users AS
SELECT * FROM (VALUES
  ('u1', DATE '2026-01-05'), ('u2', DATE '2026-01-20'),
  ('u3', DATE '2026-02-10'), ('u4', DATE '2026-03-02')
) AS t(user_id, signed_up_on);

CREATE TEMP TABLE report_views AS
SELECT * FROM (VALUES
  ('u1', DATE '2026-01-07'), ('u2', DATE '2026-01-21'),
  ('u1', DATE '2026-02-02'), ('u1', DATE '2026-02-15'),
  ('u2', DATE '2026-03-06'), ('u3', DATE '2026-02-11'),
  ('u4', DATE '2026-03-03'), ('u1', DATE '2026-04-04')
) AS t(user_id, viewed_on);

WITH settings AS (
  -- April is incomplete at this observation time; use only closed months.
  SELECT DATE_TRUNC('month', DATE '2026-04-15')::DATE AS complete_before
), cohorts AS (
  SELECT user_id, signed_up_on,
         DATE_TRUNC('month', signed_up_on)::DATE AS cohort_month
  FROM users, settings
  WHERE signed_up_on < complete_before
), sizes AS (
  SELECT cohort_month, COUNT(*) AS cohort_size
  FROM cohorts GROUP BY cohort_month
), activity AS (
  SELECT DISTINCT c.user_id, c.cohort_month,
         DATE_DIFF('month', c.cohort_month, v.viewed_on) AS month_number
  FROM cohorts c
  JOIN report_views v USING (user_id)
  CROSS JOIN settings
  WHERE v.viewed_on >= c.signed_up_on
    AND v.viewed_on < complete_before
), observed_months AS (
  SELECT s.*, n.month_number
  FROM sizes s
  CROSS JOIN range(0, 3) AS n(month_number)
  CROSS JOIN settings
  WHERE s.cohort_month + n.month_number * INTERVAL '1 month'
        < complete_before
)
SELECT m.cohort_month, m.month_number, m.cohort_size,
       COUNT(a.user_id) AS active_users,
       ROUND(100.0 * COUNT(a.user_id) / m.cohort_size, 1) AS retention_pct
FROM observed_months m
LEFT JOIN activity a
  ON a.cohort_month = m.cohort_month AND a.month_number = m.month_number
GROUP BY m.cohort_month, m.month_number, m.cohort_size
ORDER BY m.cohort_month, m.month_number;
Check the six results
| Signup cohort | Month since signup | Cohort size | Active users | Retention |
|---|---|---|---|---|
| January 2026 | 0 | 2 | 2 | 100.0% |
| January 2026 | 1 | 2 | 1 | 50.0% |
| January 2026 | 2 | 2 | 1 | 50.0% |
| February 2026 | 0 | 1 | 1 | 100.0% |
| February 2026 | 1 | 1 | 0 | 0.0% |
| March 2026 | 0 | 1 | 1 | 100.0% |
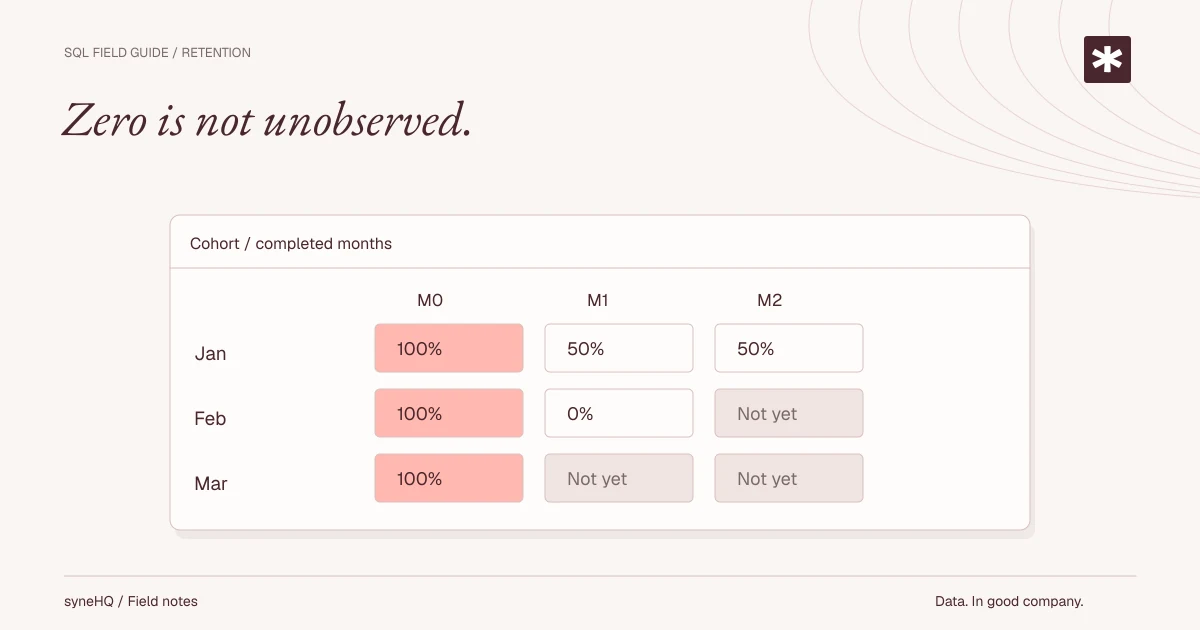
User u1 views two reports in February. That is one active user, not two retained users. User u2 returns in March after missing February; they count in March because this metric measures activity in each period independently. Continuous retention would require a different definition.
February's month one is a real zero: March finished, and that cohort had no report views. March's month one is absent because April is unfinished. If you pivot the result into a heatmap, show an absent cell as blank or “not yet observed.” Filling it with zero changes the meaning.
Month zero is 100% only because every fictional user in this fixture viewed a report in their signup month. Signup itself is not a report-view event, so the query does not force month zero to 100%.
Keep the original population
Do not build the denominator from users who appear in the activity table. A person who signs up and never views a report still belongs in the signup cohort. Dropping them makes the activation and retention numbers look better while answering a different question.
The users fixture assumes one row per user ID. Validate that uniqueness in your own source. For account-level retention, replace the population and event identity with accounts; do not divide distinct users by distinct accounts.
The observation cutoff applies to both cohort membership and activity. Events before a user's signup are excluded. In production, also decide how to handle merged identities, deleted accounts, staff accounts, test workspaces, and late-arriving events. Keep those rules stable when comparing periods.
Extend the example deliberately
range(0, 3) asks for months zero through two. Extend the upper bound for a longer report; the completeness check will still prevent immature cells from appearing. Use timestamps converted to your chosen business timezone before extracting dates if your source stores UTC timestamps but your reporting calendar is local.
A useful validation set includes a user who never returns, multiple events from the same user, a return after a gap, activity in the unfinished month, and a cohort with no activation. Compare the counts with a small hand-labelled sample before charting a large table.
Once the definition is stable, keep the query, cutoff, and output with the chart. Quantum Lab provides a workspace for that analysis, and dashboards help share a saved result. This tutorial supplies SQL, not an automatically installed SyneHQ retention model.
References
Put it to work
Run the example. Check the answer.
Start with the fictional data and complete SQL. No signup needed. Then adapt the checks to your own definitions.